bedub1 wrote: random.org wrote:When discussing single numbers, a random number is one that is drawn from a set of possible values, each of which is equally probable. In statistics, this is called a uniform distribution, because the distribution of probabilities for each number is uniform (i.e., the same) across the range of possible values. For example, a good (unloaded) die has the probability 1/6 of rolling a one, 1/6 of rolling a two and so on. Hence, the probability of each of the six numbers coming up is exactly the same, so we say any roll of our die has a uniform distribution.
This is the part you got wrong.
See, this applies ONLY TO SINGLE ROLLS. It does not apply to sets of rolls.
First, set aside the fact that dice are not truly rolled randomly. That is there is variation in our hands, in many other things that subtly influence dice. People still rely upon them becuase, for the most part, dice are unpredictable. Also set aside the fact that no computer-generated (or other) random number is really and "truly", in the absolute technical sense, "fully random", becuase its just impossible. Any computer-generated number is far more random and far less predictable than hand-thrown dice.
Now, fast forward to the distribution bit.
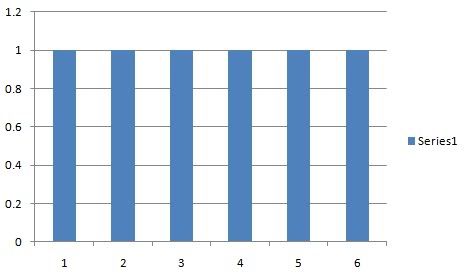
The uniformity bit only applies to individual rolls, not sequences of rolls. Although the probability for each individual die or roll, for each individual number to appear is roughly even, when you start charting this, you are
no longer charting individual rolls. Instead, you are charting the probability for multiple rolls. That is, how often do we roll a 6, then something else. How often do we roll 2 sixes, then something else. If you chart all of these combinations, you will see something like this:
LOTS of single rolls (rolling 6 once, then another number) -- the top of the curve.
Fewer chances of rolling it twice, even fewer chances of getting the same roll.
Eventually, you get something like the chance of rolling 100 rolls in a row is very, very, very, very small.
HOWEVER, note that that probability never reaches 0. So, theoretically, it is just possible for 6 to be legitimately and radomly rolles 1,000,000 times. In practice, the chance is so slim most of us would discount it, but statistically..
that probability exists.
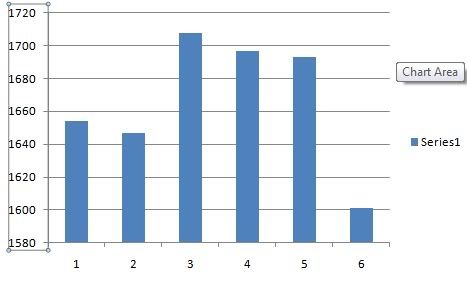
n practice we find that what number actually appears will fall on a bell curve. We call this a standard or normal distribution.
The most "normal" distribution is not that everything would be even, or uniform, but a bell curve.
The reason I know the numbers are chosen from a set without uniform distribution is because lack told us so.
bedub1 wrote:Imagine when you roll, you are rolling a 50,000 sided dice that contains the numbers 1-6. In order for the die to have perfectly uniform distribution, each number would be on the die exactly 8333 1/3rd times. Which obviously can't happen.
Here is, again where you err.
Each die must have an equal chance of appearing. However, for reasons best left to statisticians, the series of rolls in a standard population is a bell curve.
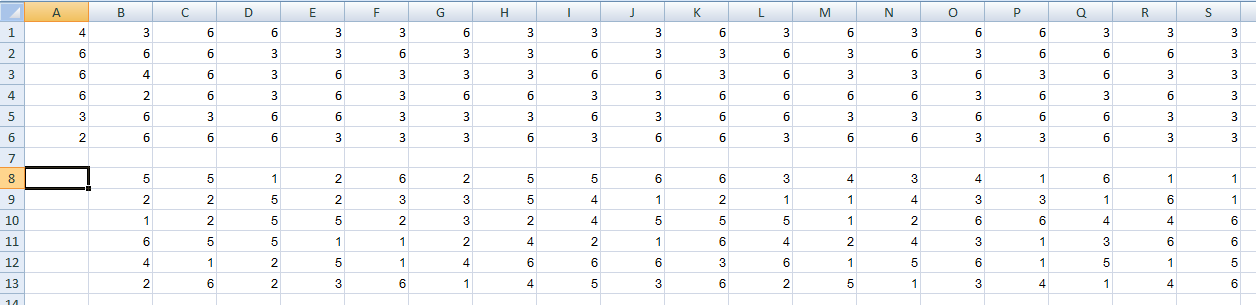
Try it with dice. For a dozen rolls, you will see some pretty skewed graphs, because you will get a few series of 4,5,6...e tc rolls in a row of the same thing. HOWEVER, if you expanded that to something like 2000 rolls, you would find a pretty normal distribution no matter who rolled and no matter how many times you rolled. Not absolutely normal, because you might have a few of the perfectly allowable extreme situations. In fact, you might just happen on an instance of, say 200 rolls in a row of the same thing. However, those occurances would be
relatively rare
The biggest problem here IS a failure to understand the difference between probability of getting a particular count in a single roll and the difference between getting a series of rolls. Again, the probability for each individual roll is even. However, the "chance" of getting any particular series of rolls is shown by a bell curve IF its a random selection of a normal, standard population (or just say "if its random, the series will fall on a bell curve)
HOWEVER, there are 2 other issues (3 actually, but the last has nothing to do with the dice) at play here:
First, there are a HUGE number of rolls here. We talk of something being "1 in a million" as if it were exceedingly rare. In fact, there are likely several million rolls every day here in CC! (remember each turn has from 2-5 dice rolled!). This means that what might feel to be "highly improbable" occurances plain happen ... and with what might seem to be heavy regularity just because of theh high numbers of rolls. I mean, your chances of winning the lottery are pretty slim, but people do win!
Second, people don't generally track individual numbers. They track wins and losses. BUT, you can get a lot of wins within a very wide range of rolls. I can roll a 3, a 4 a 5 a 6, then a 2, then a 4.... and win every single roll, if the other player simply rolls (1 or 2), (1,2 or 3), (1,2,3,4), (1,2,3,4,5), (1), (1,2,3). I am not going to bother to list the probabilities for each combination. Just look at how many combinations can get you a win..and definitely NOT because the person rolled "all 6's". So, streaks of individual numbers are absolutely possible in the most random of systems. HOWEVER, you don't really need much of a streak to get a streak of wins.
Thirdly, the actual probability of wins is skewed a bit more because of the natural, rule-based "weighting". Most of you know that the attacker rolls with up to 3, the defender defends with up to 2. That gives the attacker an attack advantage. The defender, however, wins all ties. That gives a defense advantage. Again, I am not going to lay out the statistics (its been done if you are interested). However, this will result in what might seem to be more anomolous streaks which are actually not streaks of rolls, just streaks of wins. That is, the dice are "jumping all around" with their numbers, but the impact seems to be a single streak because you only notice 2 results -- win or lose.
The fourth issue has nothing at all to do with probabilities and statistics. People just plain and simply tend to think they "ought to win" more than lose. It is an inherent, amost "given" bias, perhaps more definite among some players,but slightly there almost always. This means that we tend to remember the time we lose more than the times we win. In turn, this means we have a more negative view of the whole thing. The less mature players take losing the poorest , are also the least likely to truly understand statistics AND are the biggest complainers. However, anyone can be a bit guilty at times.
I know I have found myself wondering at times, but the bottom line is that the dice are random.