Dice Ave Roll is a crock
Soooooooo
Im sure this has been posted many times......but
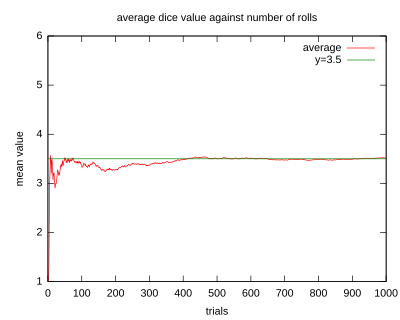
How in the hell can everyone's average roll be 3.50 or 3.51.
If the dice are really random..... I would tend to believe these averages
would very much more than the are. I may have looked at a small
sample size (100 players dice stats) but this seems unrealistic.
Maybe you need to look at other random dice generators to check statistics.
Hog wash IMO
in before: quit crying about your dice!
BaaaaHumbug!
Im sure this has been posted many times......but
How in the hell can everyone's average roll be 3.50 or 3.51.
If the dice are really random..... I would tend to believe these averages
would very much more than the are. I may have looked at a small
sample size (100 players dice stats) but this seems unrealistic.
Maybe you need to look at other random dice generators to check statistics.
Hog wash IMO
in before: quit crying about your dice!
BaaaaHumbug!