Soooooooo
Im sure this has been posted many times......but
How in the hell can everyone's average roll be 3.50 or 3.51.
If the dice are really random..... I would tend to believe these averages
would very much more than the are. I may have looked at a small
sample size (100 players dice stats) but this seems unrealistic.
Maybe you need to look at other random dice generators to check statistics.
Hog wash IMO
in before: quit crying about your dice!
BaaaaHumbug!
Dice Ave Roll is a crock
Moderator: Community Team
6 posts
• Page 1 of 1
Dice Ave Roll is a crock
![]() by willedtowin1 on Tue Dec 23, 2014 12:38 pm
by willedtowin1 on Tue Dec 23, 2014 12:38 pm
-

 willedtowin1
- Posts: 651
- Joined: Thu May 12, 2011 4:32 pm
- Location: Halfway between the Boondocks & Timbucktoo


Re: Dice Ave Roll is a crock
![]() by BigBallinStalin on Tue Dec 23, 2014 3:50 pm
by BigBallinStalin on Tue Dec 23, 2014 3:50 pm
Think of a probability distribution (those lines on the following graph). Then, let's think about the concept called "variance."
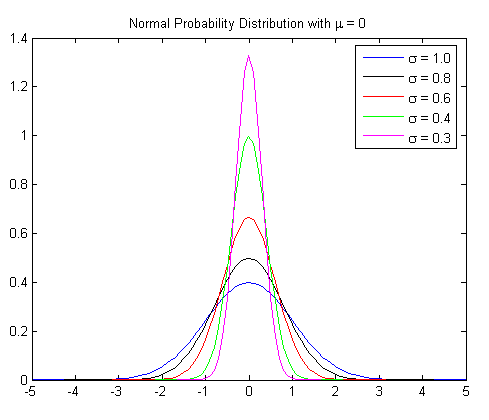
For dice, the variance, I imagine, is very small (i.e. very tight, e.g. tighter than the pink curve), such that you'll get nearly all players with 3.5 or 3.51 on average (i.e. right on the mode/median part. In the graph, the average is 0, but pretend it's 3.5). Of course, there's some chance that one player would average 3.6, and this probability would be the same for a player with an average of 3.4. But, how many players would fit this description? It depends on the variance.
With high variance, you'd have higher chances of getting individual averages beyond the average of all players. The probability distribution gets fatter (e.g. blue). With low variance, you'd get very low chances of observing a player's average deviating far from the total average. The probability distribution gets thinner (e.g. pink).
I'm assuming that the dice generate some probability distribution of very low variance, but I can't explain why. Someone more knowledgeable of statistics (and who gives a shit to spend the time explaining) will have to step up.
-

BigBallinStalin
- Posts: 5151
- Joined: Sun Oct 26, 2008 10:23 pm
- Location: crying into the dregs of an empty bottle of own-brand scotch on the toilet having a dump in Dagenham


Re: Dice Ave Roll is CRACK
![]() by owenshooter on Tue Dec 23, 2014 4:16 pm
by owenshooter on Tue Dec 23, 2014 4:16 pm
fiends rolling dice...
keepin' CC real...-Jésus noir
keepin' CC real...-Jésus noir

Thorthoth,"Cloaking one's C&A fetish with moral authority and righteous indignation
makes it ever so much more erotically thrilling"
-

owenshooter
- Posts: 13266
- Joined: Wed Mar 07, 2007 6:01 pm
- Location: Deep in the Heart of Tx


Re: Dice Ave Roll is a crock
![]() by degaston on Tue Dec 23, 2014 5:30 pm
by degaston on Tue Dec 23, 2014 5:30 pm
willedtowin1 wrote:How in the hell can everyone's average roll be 3.50 or 3.51.
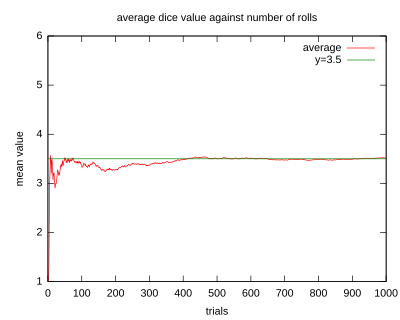
The more rolls someone has made, the closer their average should be to exactly 3.5. (The explanation is here.) The fact that many people had an average of 3.51 was one clue that there was something wrong with the dice generation last year.*
* From what I last heard, the dice are still not truly random, but at least each number now has an equal probability of showing up, and no one has an unfair advantage.
-

degaston
- Posts: 989
- Joined: Fri Apr 01, 2011 10:12 am


Re: Dice Ave Roll is a crock
![]() by Dukasaur on Thu Dec 25, 2014 11:55 am
by Dukasaur on Thu Dec 25, 2014 11:55 am
willedtowin1 wrote:Soooooooo
Im sure this has been posted many times......but
How in the hell can everyone's average roll be 3.50 or 3.51.
If the dice are really random..... I would tend to believe these averages
would very much more than the are. I may have looked at a small
sample size (100 players dice stats) but this seems unrealistic.
Maybe you need to look at other random dice generators to check statistics.
Hog wash IMO
in before: quit crying about your dice!
BaaaaHumbug!
3.5 is the expected average for rolling a D6.
(1+2+3+4+5+6)/6=3.5
The more times you roll, the closer you get to the average, and most people on CC have rolled very many times indeed.
“Life is a shipwreck, but we must not forget to sing in the lifeboats.”
― Voltaire
― Voltaire
-

Dukasaur
- Community Team

- Posts: 28098
- Joined: Sat Nov 20, 2010 4:49 pm
- Location: Beautiful Niagara


 3
3


 2
2

Re: Dice Ave Roll is a crock
![]() by loutil on Thu Dec 25, 2014 3:49 pm
by loutil on Thu Dec 25, 2014 3:49 pm
BigBallinStalin wrote:Think of a probability distribution (those lines on the following graph). Then, let's think about the concept called "variance."
For dice, the variance, I imagine, is very small (i.e. very tight, e.g. tighter than the pink curve), such that you'll get nearly all players with 3.5 or 3.51 on average (i.e. right on the mode/median part. In the graph, the average is 0, but pretend it's 3.5). Of course, there's some chance that one player would average 3.6, and this probability would be the same for a player with an average of 3.4. But, how many players would fit this description? It depends on the variance.
With high variance, you'd have higher chances of getting individual averages beyond the average of all players. The probability distribution gets fatter (e.g. blue). With low variance, you'd get very low chances of observing a player's average deviating far from the total average. The probability distribution gets thinner (e.g. pink).
I'm assuming that the dice generate some probability distribution of very low variance, but I can't explain why. Someone more knowledgeable of statistics (and who gives a shit to spend the time explaining) will have to step up.
I would suspect the larger the sample size the smaller the variance. Also, the number of possible outcomes would clearly affect the variance.

-

loutil
- Team Leader

- Posts: 784
- Joined: Fri Feb 11, 2011 2:40 pm


6 posts
• Page 1 of 1
Return to Conquer Club Discussion
Who is online
Users browsing this forum: No registered users
|
|||||||
| Conquer Club is not associated with RISK online in any way. Copyright © 2006-2025 by Big Wham LLC | |||||||